Investigating a Rise in Past-Due Orders
Operational analysis · PeopleSoft data · Excel & Tableau · Historical charts: 2020–2022
When past-due orders increased sharply, I pulled historical PeopleSoft data and compared the backlog with demand, production activity and labor hours to understand what had changed.
This page brings together the charts from that analysis. The aim was to make the change visible and give the business a clearer basis for investigating possible explanations.
What changed?
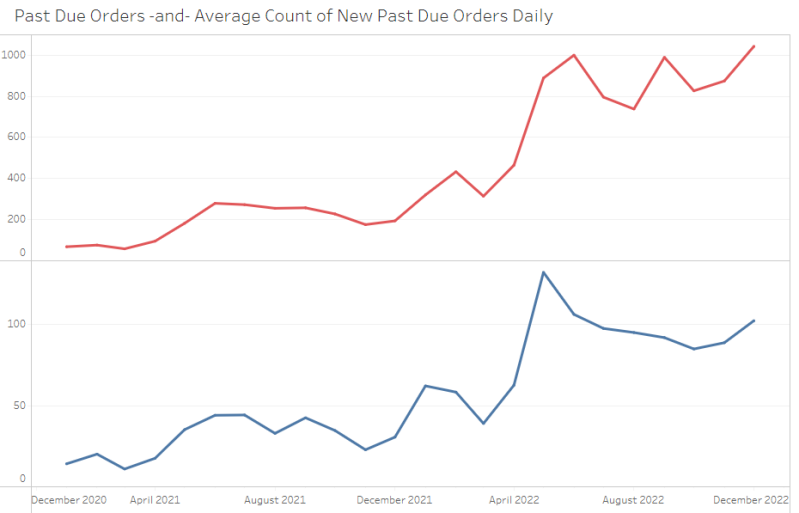
The backlog rose substantially in spring 2022. I compared the overall backlog with the number of orders newly becoming past due, then looked at other operational measures over the same period.
Top: average daily past-due order count. Bottom: average daily count of orders newly becoming past due. Each panel uses its own vertical scale.
Demand and production
I compared incoming orders with production measures to look for changes occurring around the same time as the backlog increase. These comparisons helped organize the investigation; they do not establish cause and effect.
Past-due orders compared with incoming orders.
Past-due orders compared with square footage created.
Past-due orders compared with square footage closed.
Labor and other operating measures
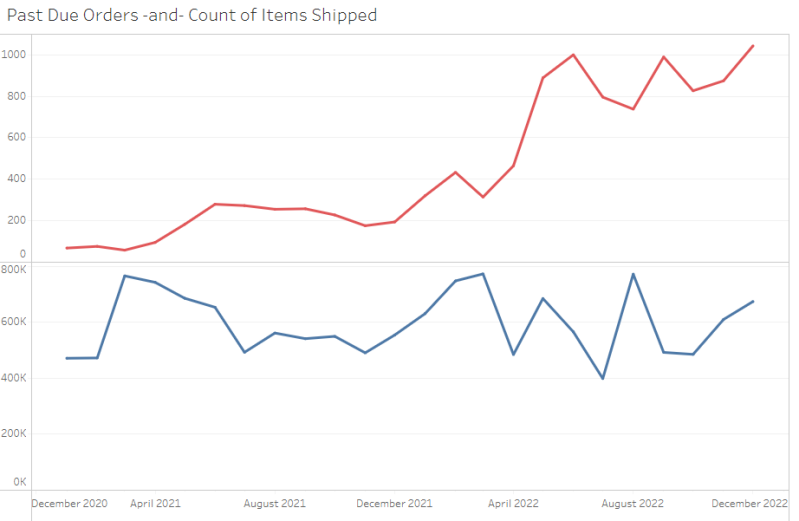
I also reviewed labor hours, shipments and scrap as possible areas to investigate. The charts show trends together so changes can be compared over time.
Past-due orders alongside total labor hours and the direct/indirect labor breakdown. Panels use different scales.
Shipments, scrap and the remaining charts
Past-due orders compared with items shipped.
Past-due orders compared with scrap.
Past-due orders compared with total labor hours.
Original view of average daily past-due orders by month.
What this work contributed
The analysis brought historical operating measures into a set of visual comparisons, making the timing and size of the backlog change easier to examine. It demonstrates how I use existing business data to frame a problem and identify questions for further investigation.
Interpretation
These charts are exploratory comparisons. They do not establish a single root cause, and I am not presenting them as proof that the backlog was resolved.